misk@sopuli.xyz to Technology@lemmy.worldEnglish · 10 months agoPassMark sees the first yearly drop in average CPU performance in its 20 years of benchmark resultswww.tomshardware.comexternal-linkmessage-square22fedilinkarrow-up1135arrow-down14cross-posted to: hackernews
arrow-up1131arrow-down1external-linkPassMark sees the first yearly drop in average CPU performance in its 20 years of benchmark resultswww.tomshardware.commisk@sopuli.xyz to Technology@lemmy.worldEnglish · 10 months agomessage-square22fedilinkcross-posted to: hackernews
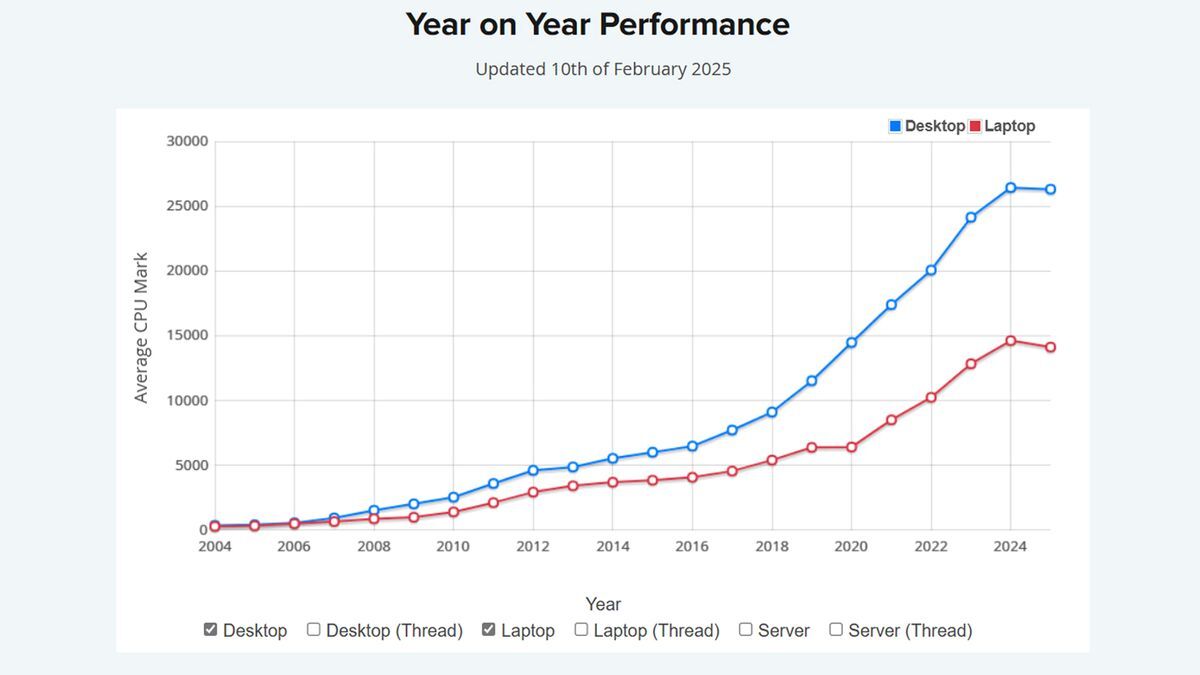
minus-squareEheran@lemmy.worldlinkfedilinkEnglisharrow-up2arrow-down1·10 months agoWhy is the graph not logarithmic? Urgh
minus-squaresource_of_truth@lemmy.worldlinkfedilinkEnglisharrow-up2arrow-down1·edit-210 months agoBecause if it was logarithmic, it would look almost horizontal.
minus-squareEheran@lemmy.worldlinkfedilinkEnglisharrow-up3·10 months agoWhat? No. Instead we would be able to see steady increases of say 10 % per year as a straight line instead of this, where it appears to be ever larger increases and the first ones essentially invisible.
minus-squaresource_of_truth@lemmy.worldlinkfedilinkEnglisharrow-up2·edit-210 months agoMy bad I was only looking at the thumbnail which was cropped and only showed the last few years.


Why is the graph not logarithmic? Urgh
Because if it was logarithmic, it would look almost horizontal.
What? No. Instead we would be able to see steady increases of say 10 % per year as a straight line instead of this, where it appears to be ever larger increases and the first ones essentially invisible.
My bad I was only looking at the thumbnail which was cropped and only showed the last few years.