
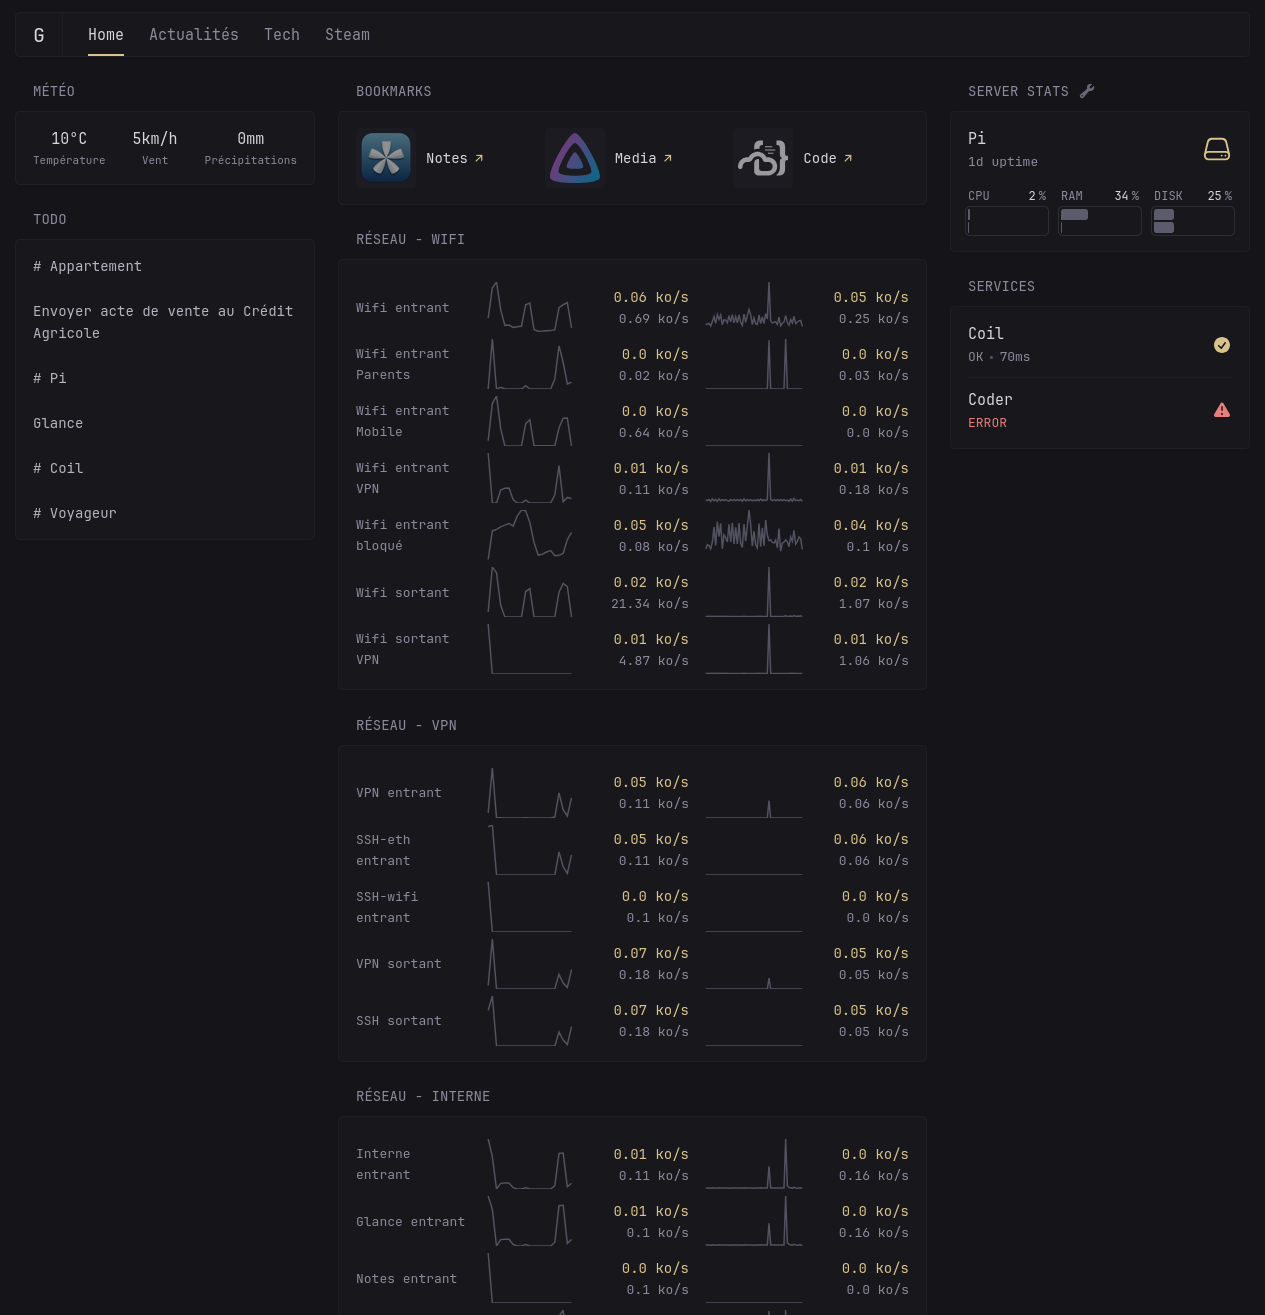
I spent some time learning and configuring my firewall, then displayed it in form of SVG graph on Glance. I’m pretty happy about the result so I wanted to share it :)
I spent some time learning and configuring my firewall, then displayed it in form of SVG graph on Glance. I’m pretty happy about the result so I wanted to share it :)
What’s your thought of homepage?
I liked Homepage. Very customizable, very well presented package and the UI is nice. I know, if you are running the *arr stack, it does a lot of interfacing with those apps. Not exclusively the *arr stack as it can interface with ProxMox to show how many VMs you’re running and load/CPU etc.
Name is silly. How does one go about finding the homepage for Homepage?
I agree it’s a bad name. Here is the link https://gethomepage.dev/
It’s pretty bad. That said, I search for “gethomepage” and find it every time.